第七章 把注意力集中在长期趋势上(1)
Focus on the Long-Term Trends
If it seems more difficult to make good profits in futures than it used to be, the fault is less with the market than with the players. The focus of the technical trader has become increasingly short-term and micro-oriented, due mainly to two factors:
如果你觉得现在交易期货比过去难赚钱,那么问题出在你身上的可能性,比出在市场上的可能要高。技术交易者的眼光越来越偏向于短期,也越来越侧重于细微之处,主要原因有两个:
1. Increased volatility and seemingly random price action results from enormous sums of investment money being thrown at markets that do not have sufficient breadth or hedging participation to cope with this huge volume of orders, and
1. 有大量的资金进入市场,但因涨跌差距不够大或者避险交易太少,不能应付庞大数量的订单,以致市场波动加剧,价格趋势变得似乎毫无章法。
2. The proliferation of powerful microcomputers and software programs that focus on short-term trading swings has convinced many technical operators that this is the new wave of the marketplace and the preferred way to trade.
2. 功能强大的电脑和软件程序日益普及,它们都是侧重于短线,让很多技术交易者误以为做短线是流行的做法,也是最好的交易方式。
Indeed, the day of the tick-by-tick computerized bar or point and figure chart, continuously on-line during the whole of each session, is fully upon us. For even a modest monthly outlay, any trader can now have five-minute (or less) bar charts flashing in rapid succession across his screen or printed out. Just imagine trading against a triple “top” created during a 30- or 40-minute segment of a single trading session. That’s pretty heady stuff, to be sure. I had a graphic demonstration of this micro-analysis recently, when a trader from Cleveland phoned and asked what I thought about the head-and-shoulders top formation he had identified in the cotton market. I could only reply with, “Huh?” And, after a brief silence, “Uh, what head and should top are you talking about? What cotton market are you looking at?” I felt like inquiring if his morning apple juice might have been left standing in the sun too long, but I resisted the impulse. In fact, I had been watching the very same cotton market, solidly entrenched in a strong and dynamic uptrend. I hadn’t detected anything remotely resembling a top formation. Under further questioning, the gentleman noted that his top formation had occurred during a two-hour period earlier in the session (August 27, 1986). I told him that he was looking at a very minute price consolidation within a strong bull trend and that I wasn’t impressed with his analysis. I advised him to look for a spot to buy, rather than to sell. The market apparently shared my opinion, for by the close we saw new highs. This earnest gentleman’s triple top formation had been sundered as if it didn’t exist-which it didn’t! (See Figure 7-1.)
的确如此,每天的柱状图或者点数图,整个交易时间内不断延伸的数据线,占满了我们的视野。我们每个月只要花很少的钱,就能在屏幕上或报表上看到快速闪进的5分钟(或更短)柱状图。我们不妨试想:在一个交易日内短短的30或40分钟里,见到头肩顶就想马上交易的情形。可以肯定,这么做未免太辛苦了。最近有人向我展示这么一个在屏幕上做细微分析的图形。有一天,克利夫兰的一位交易者打电话来,说他刚在棉花市场上看到头肩顶形成,问我的看法怎么样。我只能回答:“啊,真的?”沉默了一下之后,我又说:“哦,你说的是哪个头肩顶?你看的是哪个棉花市场?”我真想问他早上是不是把苹果汁放在太阳底下摆太久了,但我忍住冲动,没有问他。事实上,我一直在注意的棉花市场跟他看到的是同一个市场:这个市场早就呈现牢不可破的上涨趋势,而且趋势强劲,活泼有力。从长线的角度来看,我看不到有什么地方像是在做头。我再逼问他,头在哪里,他才说在当天(1986年8月27日)那个交易日内的两个小时内形成的。我告诉他,他看到的是一个强大的多头市场里面一个很微不足道的整理,根本没什么了不起。我建议他找个价位买入,而不是卖出。市场趋势显然跟我的看法相同,到收盘的时候,新高点出现了。从后来的趋势来看,那位仁兄所说的头肩顶根本不存在——事实上根本不存在!(见图7-1)
图7-1 1987年7月棉花 (文字:某人所说的头肩顶)
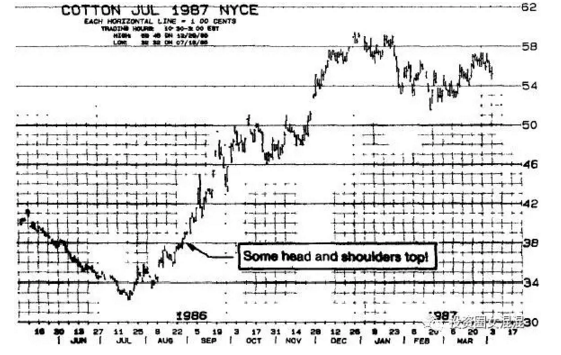
【Can you imagine – someone seeing a head and shoulder top formation on August 27 on the basis of a tick-by-tick micro-analysis. The trader even went short on the basis of his analysis. His top formation lasted about an hour. This was, in fact, an excellent buying opportunity, especially on the close, when new highs were registered. From that point, it was “off to the races.”
你能想象吗?有人根据按分钟跳动的细微图形分析,说8月27日有头肩顶形成。这位交易者甚至根据自己的分析做空。他所称的头部只持续了约一个小时。事实上,这是个绝佳的买入良机,特别是收盘见到新高价时。从那里开始,市场“开始飙升”。】
This trader’s micro-oriented approach to short-term scalping is the antithesis of long-term position trading, which provides the best opportunity for consistent profits and limited risks. Keeping your primary focus on the longer-term trends allows you to avoid being distracted by daily market “noise” and to maintain a better perspective on price and trend action. How can the trader sitting in front of a five-minute tick-by-tick price chart have any balanced perspective on a market? Three to four hours is long-term to him.
交易者要用那么细微的方法去做短线,刚好跟做长线的方法背道而驰。长线交易所提供的机会最大,不但能持续获利,而且风险很小。把注意力放在比较长的趋势上,就可以避免被市场上每天发出的杂音骚扰,并且能够对价格和趋势走向保持更好的观察。交易者眼睛盯着5分钟的价格趋势图,怎能对市场保持平衡的观察?对这种人来说,3-4个小时就算是长线了。
Long-term weekly and monthly continuation charts are essential elements in the position trader’s tool kit. I would no sooner trade futures without these charts than I would sail across an ocean without navigation charts.
长线交易者的工具箱里,一定备有长期的周线图和月线图。没有这些图,我根本不敢交易期货,就像没有航行图,不敢扬帆出航一样。
In addition to giving a clear-cut picture of major trends, these long-term charts provide the ideal view of likely support and resistance levels. I say “likely” because, while there is no sure road to trend and support/resistance identification, these long-term charts are the most effective toll you can find for doing the job. My major copper campaign comes to mind here. It was mid-1972, and my ongoing study of the big picture in various markets revealed that copper had been trading within a broad sideways zone of 45.00 to 55.00, coinciding with a solid long-range support area. The market found good support on reactions into the mid-40s and heavy selling pressure on rallies to the mid-50s. Furthermore, a study of copper’s long-term price cycle indicated that, since 1964, we had had an important bull move every few years, as follows:
这些长期趋势图除了能对主趋势提供一目了然的画面外,还能提供很理想的观点,告诉我们什么地方可能有支撑,什么地方可能有压力。我说“可能”,是因为这个世界上找不到万无一失的方法,很难百分之百找出趋势和支撑/压力点,但是这些长期图形是你所能找到,做这件事情最有效的工具。讲到这里,我就想到那次交易铜的故事。那是1972年年中的事,我持续对各种市场做了深入而广泛的观察,我发现铜在宽广的横向盘整区间45.00——55.00交易,碰巧是长期的强支撑区。市场在回调到45左右时,就能找到良好的支撑,反弹到55左右时,又会出现沉重的卖出压力。而且,进一步研究铜价的长期价格循环周期时,可以发现从1964年以来,每隔几年,就有一次很重要的多头趋势出现,如下所述:
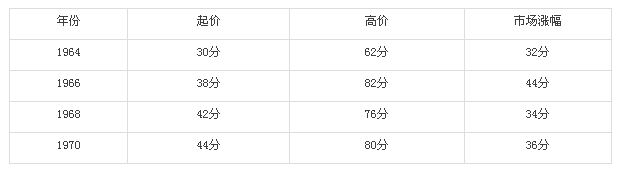
I wasn’t too impressed with the regularity of the every-two-years thing because that was probably coincidence. Nevertheless, the long-term charts (see Figure 7-2) clearly gave important clues to the big picture in this dynamic market. They reveled the each of the bottoms – the starting point for the big rallies (30.00, 38.00, 42.00, and 44.00) – was progressively higher than the previous bottom. With the major trend still sideways, I went to my short-term (pre-computer era) tools-daily charts, trend-lines, and moving average studies. On the basis of this analysis, I began accumulating a long position in copper in the 48.00 to 50.00 area, ultimately holding some 350 contracts.
对于这种每两年固定出现一次的形态,老实说,我并不是很在意,因为那可能是巧合。但是长期趋势图(见图7-2)却可看出一个重要的端倪,明显指出这个活力充沛的市场中有机会。长期图显示底部——大涨行情的起价(30.00,38.00,42.00和44.00)——都是一底比一底高。由于主趋势仍然横向盘整,于是我翻出了短期(电脑时代以前)工具——日线图形,趋势线,移动平均线。根据这个分析,我开始在48.00——50.00的区间内慢慢加仓建立铜的多头仓,最后持有约350份合约。
图7-2 铜 长期月线图(文字:突破)
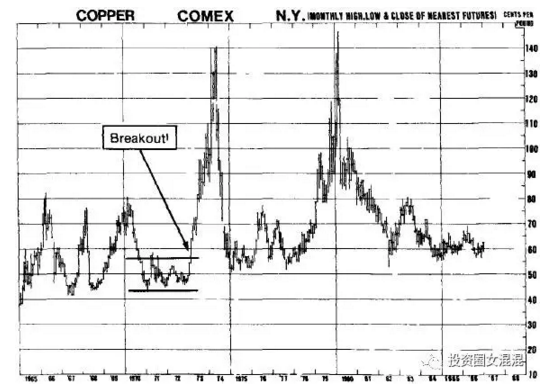
【During 1971 and 1972, copper traded within a broad range bounded by 45.00 and 55.00, representing a solid long-term support zone. I accumulated a large position between 48.00 to 50.00. The market came out of this trading range heading north on the early January 1973 close above 59.00. It didn’t even pause until reaching the 70.00 level. The brief consolidation around 70.00 proved temporary, and by first-quarter 1974, values had reached 1.30 to 1.40. Traders in the mid-1980s, watching the market mired in the 55.00 to 77.00 range, look longingly at these bull market peaks.
1971-1972年间,铜价在45.00-55.00的大区间内交易。这个区间是很坚实的长期支撑区。我在48.00-50.00之间积累了很大的仓位。1973年1月初收盘价高于59.00,趋势终于突破这个交易区间开始上升,一路不停,直接涨到70.00。70.00附近短暂整理后,1974年春季价格涨到了130-140。到了1985年左右,价格又回到55.00——70.00之间,交易者不禁引颈期盼以前的那些高价到来。】
One morning, a young man called at my office at 25 Broad Street. He was the scion of an important Far East private banking family, and, after the requisite small talk, he got to the point of his visit.
一天早上,有位年轻人来到我在宽街的办公室。他是远东一个重要民间银行家族的后裔。经过一阵不可缺少的寒暄他道明了来意。
“We understand that you are a large buyer of Comex copper. May I ask you why?”
“我们知道你在纽约商品交易所买了很多黄铜,可不可以请教你其中原因何在?”
“Well, isn’t that obvious?” I asked in return. “Because I expect prices to move higher.”
“哦,那还不够清楚吗?”我反问。“因为我认为价格会上涨。”
He continued his cagey interrogation for a while longer. When he fathomed that I had not been privy to any inside information and was playing this strictly on the basis of my technical studies combined with a long-term strategy, he showed me his bank’s voluminous copper study prepared by a team of prominent economists. The gist of the study: Copper was in great oversupply, demand was weak and would remain that way, and prices would continue depressed for at least another year. At that point, I was understandably not feeling very well. I thought that I too might continue depressed for a long time.
他继续小心翼翼地探询。最后他终于搞清楚我并没有任何内幕消息,而只是纯粹依据技术分析和长期交易策略来交易时,他拿出自己银行所编的一本厚厚的铜价研究报告。这本报告是一群知名经济学家编写的,要点是:铜已经严重过剩,需求疲软,铜会长期过剩,价格至少会再疲软一年。当时,我很不爽。我想,我的心情也会疲软很长时间。
Could they be right? My banker friend left me with a copy of his report plus a bad case of the jitters. I left too for the rest of the day to try and calm what was left of my nerves and to prevent myself from calling the floor and liquidating my long position. It took me two days to recover from his little (psychological warfare) visit. Yes, there was too much copper in warehouse-far too much! And it was indisputable that this enormous supply was weighing heavily on the market.
难道他们是对的?这位银行家朋友丢下报告复印件就走了,却让我坐立不安。他走了之后,我也出去了,我要抚平紧张的神经,并防止自己打电话到营业厅,把多头仓平掉。这个人的来访,让我心里不安,两天后我的心情才平静下来。没错,仓库里堆积的黄铜确实太多了——多的不像话!毫无疑问,庞大的供给量给市场带来了沉重的压力。
And no one could have foreseen – least of all the learned economists who had prepared that detailed analysis – how the copper market could have avoided another year of depressed prices. I couldn’t either, for that matter, but I didn’t let it bother me. The market action told me, in no uncertain terms, that prices were stabilizing at these levels and that positions were being accumulated by knowledgeable and well-capitalized interests. Ultimately, the course of least resistance would be north. That was my conclusion-my strategy was to hold the long position and to buy more on a weekly close above 56.00, projecting an initial long-term price objective into the mid-70s.
包括那些一肚子学问的经济学家在内,没有任何人知道铜的价格会怎么走,我也不知道,但我不希望这件事继续烦我。市场趋势斩钉截铁地告诉我,价格正要稳住当时的水准,而且不少有识之士和财力雄厚的人正在加仓。最终,阻力最小的方向当然是往上走。这就是我的结论——我的策略是:持有多头仓,周收盘价高于56.00就多买些,初步的长期目标看到75.00左右。
What actually happened was deceptively simple. One day, not long afterward, a Chinese trade group arrived in London, ostensibly to buy feed grain and other agricultural products. But when they left for home, they had bought nearly all the copper. And a year later, when my banker friend said he would buy his copper, on the basis of that fancy and credentialized analysis, it was selling at over $1.00.
实际发生的事情非常简单。之后不久有一天,中国大陆的一支贸易团到达伦敦,表面上是买谷物和农产品,但是在离开之前,他们几乎买光了所有的铜。一年后,那位银行家朋友根据那份华丽且归类为机密文件的报告而想要买铜时,市价已经超过100了。
One final footnote to this campaign. When the ink had dried on our final closeout slips, the total profit on the position came to about $1.3 million.
关于这次黄铜战役,有必要说一下,最后几张单子卖出时,成交单上面的墨汁还没干,整个仓位总共赚了大约130万。

每日精彩,欢迎扫描二维码关注期乐会微信公众平台。
感谢作者辛苦创作,部分文章若涉及版权问题,敬请联系我们。
纠错、投稿、商务合作等请联系邮箱:287472878@qq.com

